Tag: household surveys

Can Uganda attain zero-hunger?

Uganda is one of the fastest economically growing nations in sub-Saharan Africa and is in the midst of socio-economic transition. Over the past two decades the country’s GDP has expanded, on average, by more than 6% each year, with per capita GDP reaching $710 in 2019. Researchers project that this will continue to rise at a rate of 5.6% each year for the next decade, reaching approximately $984 by the year 2031.

This growth is mirrored by a rising population and rapid urbanization within the country. In 2019, 24.4% of the Uganda’s 44.3 million citizens were living in urban areas. By 2030, population is projected to rise to 58-61 million, 31% of whom are expected to live in towns and cities.

“Changes in population, urbanization and GDP growth rate all affect the dietary intake pattern of a country,” says Khondoker Mottaleb, an economist at the International Maize and Wheat Improvement Center (CIMMYT). “Economic and demographic changes will have significant impacts on the agricultural sector, which will be challenged to produce and supply more and better food at affordable prices.”

This could leave Uganda in a precarious position.

In a new study, Mottaleb and a team of collaborators project Uganda’s future food demand, and the potential implications for achieving the United Nations Sustainable Development Goal of zero hunger by 2030.

The authors assess the future demand for major food items, using information from 8,424 households collected through three rounds of Uganda’s Living Standards Measurement Study — Integrated Surveys on Agriculture (LSMS-ISA). They focus on nationwide demand for traditional foods like matooke (cooking banana), cassava and sweet potato, as well as cereals like maize, wheat and rice — consumption of which has been rising alongside incomes and urbanization.

A conceptual framework of changing food demand in the Global South. (Graphic: CIMMYT)

The study findings confirm that with increases in income and demographic changes, the demand for these food items will increase drastically. In 2018, aggregate consumption was 3.3 million metric tons (MMT) of matooke, 4.7 MMT of cassava and sweet potato, 1.97 MMT of maize and coarse grains, and 0.94 MMT of wheat and rice. Using the Quadratic Almost Ideal Demand System (QUAIDS) estimation approach, the authors show that in 2030 demand could be as high as 8.1 MMT for matooke, 10.5 MMT for cassava and sweet potato, 9.5 MT for maize and coarse grains, and 4 MMT for wheat and rice.

Worryingly, Mottaleb and his team explain that while demand for all the items examined in the study increases, the overall yield growth rate for major crops is stagnating as a result of land degradation, climate extremes and rural out-migration. For example, the yield growth rate for matooke has reduced from +0.21% per year from 1962-1989 to -0.90% from 1990-2019.

As such, the authors call for increased investment in Uganda’s agricultural sector to enhance domestic production capacity, meet the growing demand for food outlined in the study, improve the livelihoods of resource-poor farmers, and eliminate hunger.

Read the full article, Projecting food demand in 2030: Can Uganda attain the zero hunger goal?
100Q: Boosting household survey data usability with 100 core questions

A set of core survey questions has been developed in a bid to improve the collection and use of rural farm household data from low and middle-income countries.

Leading agricultural socioeconomists developed the 100Q report, which outlines 100 core questions to identify key indicators around agricultural activities and off-farm income, as well as key welfare indicators focusing on poverty, food security, dietary diversity, and gender equity.

The aim is to forge an international standard approach to ensure socioeconomic data sets are comparable over time and space, said Mark Van Wijk, the lead author of the recent report published through CGIAR Platform for Big Data in Agriculture.

Agricultural researchers interview hundreds of thousands of farmers across the world every year. Each survey is developed with a unique approach for a specific research question. These varied approaches to household surveys limit the impact data can have when researchers aim to reuse results to gain deeper insights.

“A standard set of questions across all farm household surveys means researchers can compare different data points to identify common drivers of poverty and food insecurity among different populations to more efficiently inform development strategies and improve livelihoods,” said Van Wijk, a senior scientist at the International Livestock Research Institute (ILRI).

Finding common ground among data collection efforts is essential for optimizing the impact of socioeconomic data. Instead of reinventing the wheel each time researchers develop surveys, researchers in the CGIAR’s Community of Practice on Socio-Economic Data (CoP SED) formed core questions they believe should become the base of all farm household surveys to improve the ability for global analysis.

CoP SED is promoting the use of the 100Q report as building blocks in survey development through webinars with international agricultural researchers. The community is also doing further research into tagging existing survey data with ontology terms from the 100Q to improve reusability.

Harmonization key to the fair use of data

Bengamisa, DRC. (Photo: Axel Fassio / CIFOR)

Managing shared data is becoming increasingly important as we move towards an open data world, said Gideon Kruseman, leader of the CoP SED and author of the report.

“For shareable data to be actionable, it needs to be FAIR: findable, accessible, interoperable and reusable. This is the heart of the Community of Practice on Socio-Economic Data’s work.”

At the moment, international agricultural household survey data is disorganized; the proliferation of survey tools and indicators lead to datasets which are often poorly documented and have limited interoperability, explained Kruseman.

It’s estimated that CGIAR—the world’s largest network of agricultural researchers—conducts interviews with around 180,000 farmers per year. However, these interviews have lacked standardization in the socioeconomic domain for decades, leading to holes in our understanding of the agriculture, poverty, nutrition, and gender characteristics of these households.

The 100Q tool has been systematically designed to enable the quantification of interactions between different components and outcomes of agricultural systems, including productivity and human welfare at the farm and household level, said Kruseman, a Foresight and Ex-Ante Research Leader at the International Maize and Wheat Improvement Center (CIMMYT).

Streamlining survey data through the world’s largest agricultural research network

Aerial view of the landscape around Halimun Salak National Park, West Java, Indonesia. (Photo: Kate Evans/CIFOR)

Using these building blocks should become standard practice across CGIAR. The researchers hope standardization across all CGIAR institutes will allow for easier application of big data methods for analyzing the household level data themselves, as well as for linking these data to other larger scale information sources like spatial crop yield data, climate data, market access data, and roadmap data.

Researchers from several CGIAR research organizations, the Food and Agriculture Organization of the United Nations, and agricultural nonprofits worked to create the common layout for household surveys and the sets of ontologies underpinning the information to be collected.

“Being able to reuse data is extremely valuable. If household survey data is readily reusable, existing data sets can be used as baselines. It allows us to easily assess how welfare indicators vary across populations and different agro-ecological and socioeconomic conditions, as well as how they may change over time,” Kruseman said.

“It also improves the effectiveness of interventions and the trade-offs between outcomes, which may be shaped by household structure, farm management, and the wider social-environmental.”

CoP SED researchers work in three groups towards improving socioeconomic data interoperability. The 100Q working group focuses on identifying key indicators and related questions that are commonly used and could be used as a standard approach to ensure data sets are comparable over time and space. The working group SEONT focuses on the development of a socioeconomic ontology with accepted standardized terms to be used in controlled vocabularies linked to socioeconomic data sets. The working group OIMS focuses on the development of a flexible and extensible, ontology-agnostic, human-intelligible, and machine-readable metadata schema to accompany socioeconomic data sets.

For more information, visit the CoP SED webpage.

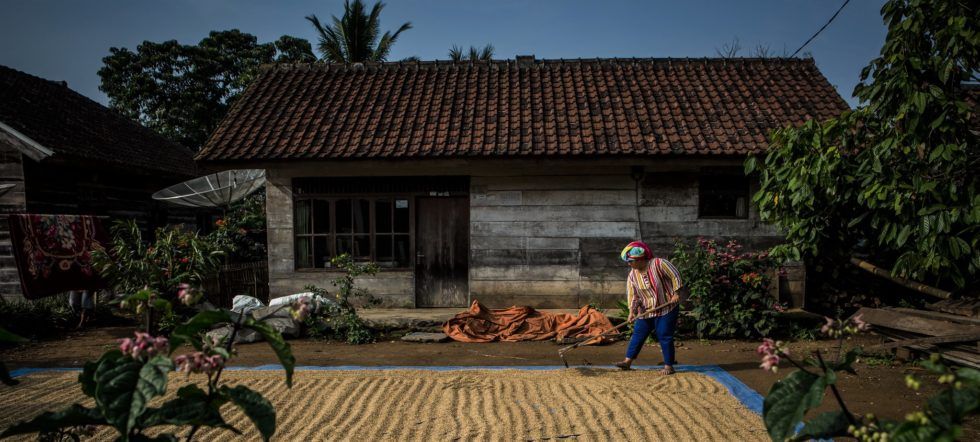
Cover photo: A paddy in front of a house in Tri Budi Syukur village, West Lampung regency, Lampung province, Indonesia. (Photo: Ulet Ifansasti/CIFOR)